PriceGauge
PriceGauge delivers granular, anonymised post execution transactional pricing benchmarks across the London Market, so you know exactly where your rates sit, and what the market is doing around you. Go into every renewal, negotiation and client conversation with real market evidence behind every decision.
Independent pricing intelligence. Across the whole market.
Every broker and carrier in the London Market has internal pricing data. But that only reflects the risks you’ve placed or written. While it shows you your own position, it doesn’t give you insight into what the wider market is doing. PriceGauge gives you that clarity.
What PriceGauge is
PriceGauge provides granular, anonymised pricing benchmarks drawn from across the London Market. Because we process around 80% of risks placed in London, the benchmarks are genuinely representative, not estimates or limited samples. It uses the market's own pricing data, aggregated and returned in a usable format.
Benchmarks are calculated as rate on line – gross premium divided by aggregate limit minus deductible. They are expressed per £1 GBP, per £100k GBP or per £1m GBP depending on the context and user preference. Data is updated monthly and quarterly giving you a current and consistent view of where the market is at any given point.
Granularity benchmarking that reflects the market
Benchmarks are only useful if you compare like-for-like. PriceGauge adjusts for a wide range of variables – risk type, risk size, client size, industry sector and attachment points. For example, a mid-sized North American technology company's D&O risk is compared against equivalent risks, not the entire D&O market. That depth of segmentation is what turns broad pricing information into genuinely actionable insight.
The attachment point capability is particularly valuable for carriers working with layered programmes. Large, complex London Market risks are often structured as tower programmes, where multiple carriers participate at different risk levels and the price of insuring each layer varies significantly. PriceGauge can benchmark pricing at each level, helping carriers assess if their rate is competitive and appropriate across every point.
Trend tracking with delta and gamma
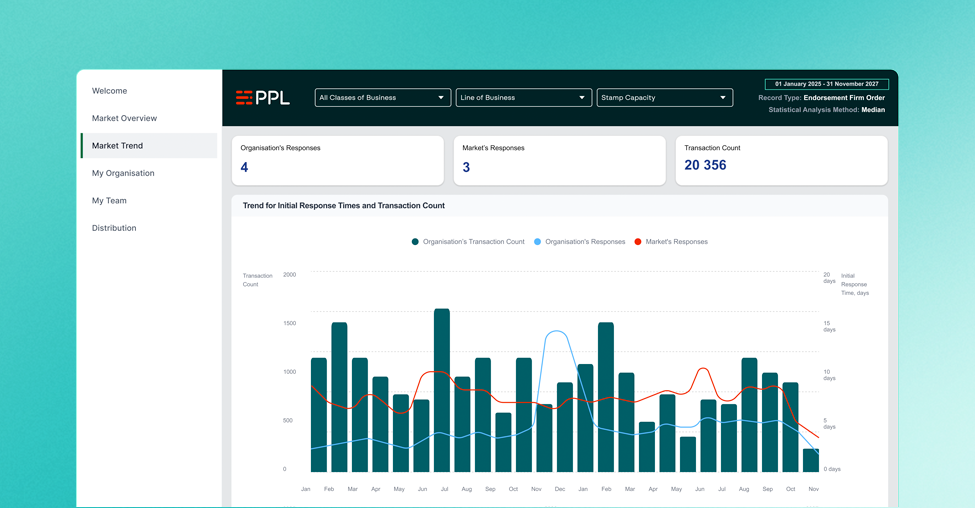
Understanding where the market is today is valuable. Understanding where it’s heading is more valuable still. PriceGauge provides monthly and quarterly trend data that tracks not only the pricing level, but the direction and pace of change.
Delta measures the degree of price change between periods, telling you how much rates have moved. Gamma measures the speed of that change, helping you understand if the market is accelerating, slowing or stabilising. Each scenario calls for a different strategic response. PriceGauge’s data helps you identify which applies before market sentiment catches up.
Breadth and depth working together
No single data source can give a complete picture. We offer broad market visibility across around 80% of risks placed in London, built from 25 transactional data fields per risk. While your own internal data gives you deep insight on your clients and book, it represents a small slice of the market. PriceGauge is designed to complement your own internal data, working in tandem to provide underwriting and actuarial teams with a foundation based on market depth and breadth for strategic decision-making.
How brokers use PriceGauge
Brokers use PriceGauge benchmarks in renewal packs and client presentations to provide genuine market context for the cover being placed. When a broker can show clients both the price achieved and how it compares with equivalent risks across the market, conversations shift from transactional to consultative. Year-on-year and month-on-month trend data also helps brokers indentify market movement indicators, and explain how they impact a client’s specific risk profile, cover terms, and claims history.
PriceGauge provides the indicators. The broker brings the interpretation and the judgment.
Internally, broker managers use PriceGauge to understand how their own book is positioned relative to the market by segment, and how their pricing performance compares to market averages – by business line and by team.
How carriers use PriceGauge
Underwriters use PriceGauge to assess their pricing competitiveness across every line of business they write in the London Market, broken down by geography, premium band, industry sector and attachment point. If their pricing in a particular segment is above market average, they can choose to maintain that position. When carriers can see that a segment is above or below market average, they can make an informed decision about either maintaining or adjusting their position. Monthly updates provide timely feedback into how quickly those decisions translate into changes in trading activity.
Portfolio managers and senior leaders use cross-line PriceGauge data to understand how different segments of their book are performing relative to the market, forecast capacity needs, and identify market turning points before they appear in reporting cycles.
Ready to trade smarter?
Discover how PPL helps you place risk faster, make better-informed decisions, grow your position, and compete in the London Market.
Existing clients looking for client service support should contact helpdesk@pplnextgen.com